
Welcome back traders 👋
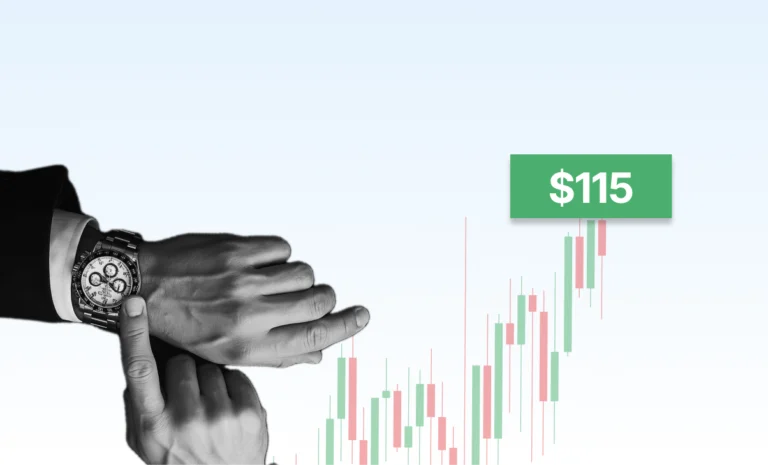
Oil is up 4.71% today. Trump has issued an 8pm ET deadline for Iran to reopen the Strait of Hormuz. Price is aggressively testing $115 — the exact resistance level we marked before Easter.
But before you look at the headline, experienced traders look at something else first. They check the moving averages. Here’s why that matters, and what today’s oil chart is telling you right now.
What a Moving Average Actually Is
A moving average takes the closing price of an asset over a set number of days and averages them into a single line on your chart. The MA20 uses the last 20 days. The MA50 uses the last 50 days.
That line smooths out the noise — the random daily spikes and drops — and shows you the underlying direction of price. Think of it as the difference between weather and climate. A single day’s price move is weather. The moving average shows you the climate.
When price trades above the MA20 and MA50, buyers have been in control consistently. When price drops below them, sellers are taking over. It’s one of the simplest and most widely used signals in trading — which is exactly why it works. Enough traders watch the same levels that those levels start to matter.
The rule traders use: Price above MA20 and MA50 = buyers in control, trend intact. Price below both = sellers winning, trend weakening. A cross of price through either line is often the first signal that something is changing.
What Today’s Oil Chart Is Showing
Right now WTI Crude is sitting above both the MA20 and MA50. That tells you the bullish trend from the Iran conflict is still structurally intact — buyers have been consistently in control for weeks, not just today.
Price is testing $115 resistance. That level was our target from last week. If you had it marked, well done. 👍
The moving averages are what give you confidence in the setup. A price at resistance with both MAs below and rising is a very different picture from a price at resistance with MAs above and falling. The first says the trend supports a potential breakout. The second says the trend is working against it.
Today it’s the first picture. Trend intact, price at a key level, major catalyst incoming at 8pm ET.
Two Scenarios Into the Deadline
Trump’s 8pm deadline for Iran is the event that decides this. Both outcomes are clean:
📈 Deadline passes without de-escalation: Supply fear intensifies, buyers push through $115, next target is $120. A daily close above $115 is the confirmation.
📉 Surprise ceasefire signal or deadline extension: Fear premium unwinds fast. Watch for price to drop back below the MA20 — that’s the first warning sign. $109-$110 support becomes the next floor.
The moving averages are your guide throughout. As long as price holds above the MA20, the bullish structure is intact. A clean break below it changes the picture.
How to Use This in Practice
This is exactly the kind of setup the Trading Game is built for. You have a clear trend confirmed by moving averages, a defined resistance level, and a known catalyst at a specific time. Everything is structured. The only unknown is which way the headline breaks.
Watch This Setup Play Out Tonight
Oil is live in the Trading Game app with real market data. Copy this setup to your chart and track how price reacts at $115 into Trump’s 8pm deadline — no real money at risk. Want to understand moving averages properly before tonight? Chapter 4 of the Trading Game Academy walks through it step by step.