Listen up traders 👋
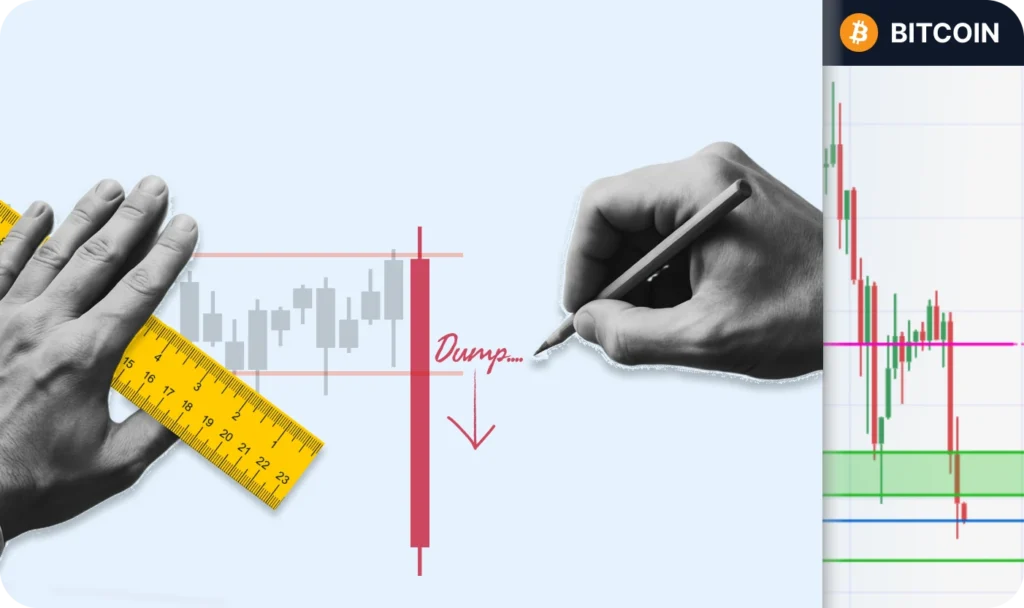
Bitcoin has just slipped below the 107K–106K USD support zone, a level we’ve been tracking closely in recent sessions. The next key area of interest now lies near 105K, right around the monthly trendline that has served as Bitcoin’s compass for most of the year.
This shift doesn’t necessarily signal panic – it signals perspective.
For Beginners: The Power of the Zoom-Out
When you look at a 1-hour chart, every candle feels like a story of triumph or disaster. But step back to the daily or monthly chart, and you see something entirely different – structure, rhythm, and balance.
Today’s move below 107K is a great real-time lesson for anyone learning through a trading simulator what feels dramatic in the short term is often just a retest of long-term structure.
If you’re new to trading, practice spotting such levels in a demo or stock market game environment before committing real capital. It helps you train your emotional discipline – a trader’s most underrated skill.
For Regulars: Structure Is Everything
Seasoned traders know the magic word – confluence.
When multiple signals align (like a retest of monthly trendline + demand layer), the probability of a bounce increases.
The 105K level now sits at the heart of that confluence zone. Whether Bitcoin stabilizes here or dips slightly lower, copying that monthly trendline to your chart could be invaluable. It has guided the trend for months – almost like a backbone holding the bull structure together.
As Jesse Livermore once said:
“It was never my thinking that made the big money for me. It was always my sitting.”
Takeaway
Markets reward those who combine curiosity with discipline.
Zooming out isn’t just a charting trick – it’s a mindset. When everyone else reacts to the noise, the patient trader sees the signal.

