
Attention on Ethereum!👋
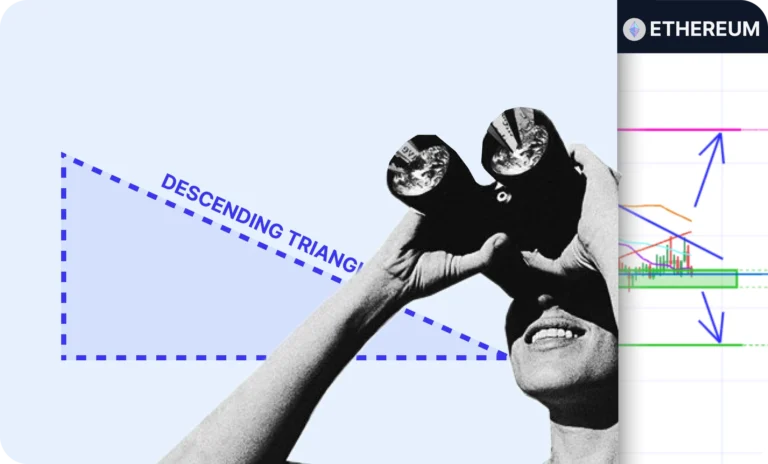
ETH has been forming a descending triangle on the 4h chart over the past few weeks. If you’ve been following the chart pattern lessons, you’ll recognize this setup. Price is now right near the apex, the stage where volatility usually returns.
Triangle Structure 📐
-
Lower highs have stacked up since the failed breakout near 4,873
-
Support has held multiple times between 4,250–4,306
-
Price is pressing into the squeeze, where breakouts or breakdowns often trigger cleaner moves
ETH is trading around 4,290, sitting back in the support zone. Buyers have defended this area heavily before, but repeated tests are showing signs of weakness. No breakout above the descending trendline yet, which keeps short-term bias neutral to slightly bearish. Here’s what we’re looking at 👇
📈 If price moves up:
-
A break and hold above the descending trendline shifts momentum
-
First upside target is 4,665, a proven resistance zone
📉 If price breaks down:
-
A clean move below 4,250, especially with volume, confirms the bearish setup
-
Next downside support sits around 4,098
👉 The next major move will come from how ETH reacts at these key levels.
💡 Refresh the triangle lessons to understand the why behind this chart, from entry triggers to invalidation and risk management.
